Business Intelligence & Data Analytics
Build interactive dashboards with charts, pivot tables, data tables, and embeddable web components — all powered by ReportBurster.
What You Can Build
ReportBurster delivers interactive reports and dashboards directly where your users work.
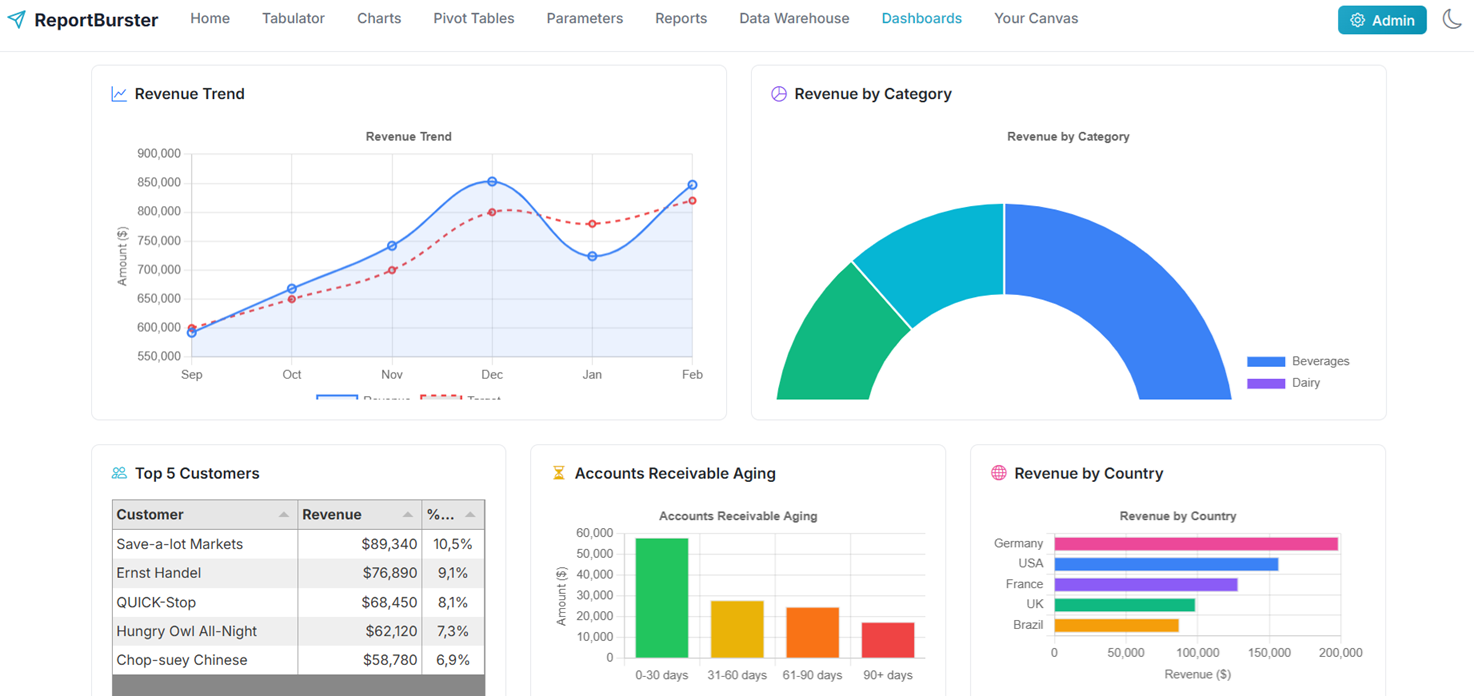
- Dashboards — KPI cards, charts, data tables, pivot tables, and parameter filters in a single view
- Embedded Components — drop
rb-*web components into any web application - Data Warehouses — DuckDB for embedded OLAP, ClickHouse for enterprise scale
How It Works
Step 1: Configure Your Report
In ReportBurster, go to Configuration → Reports and set up your data source, visualizations, and parameters. Each component has dedicated documentation:
- Dashboards — combine all components into one interactive view
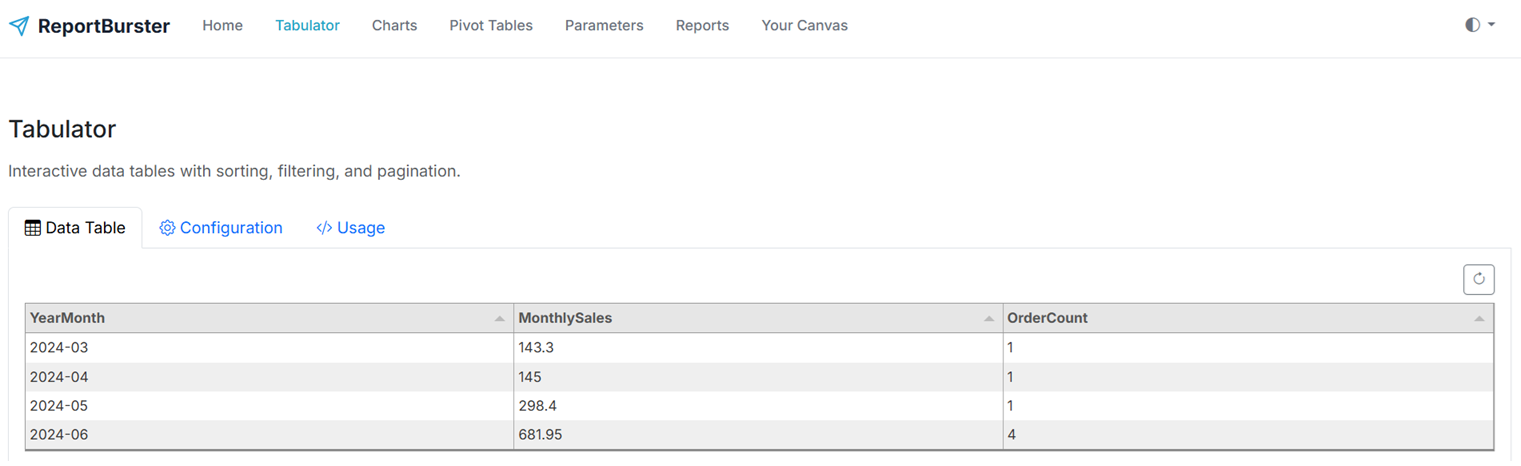
- Data Tables — sortable, filterable data grids
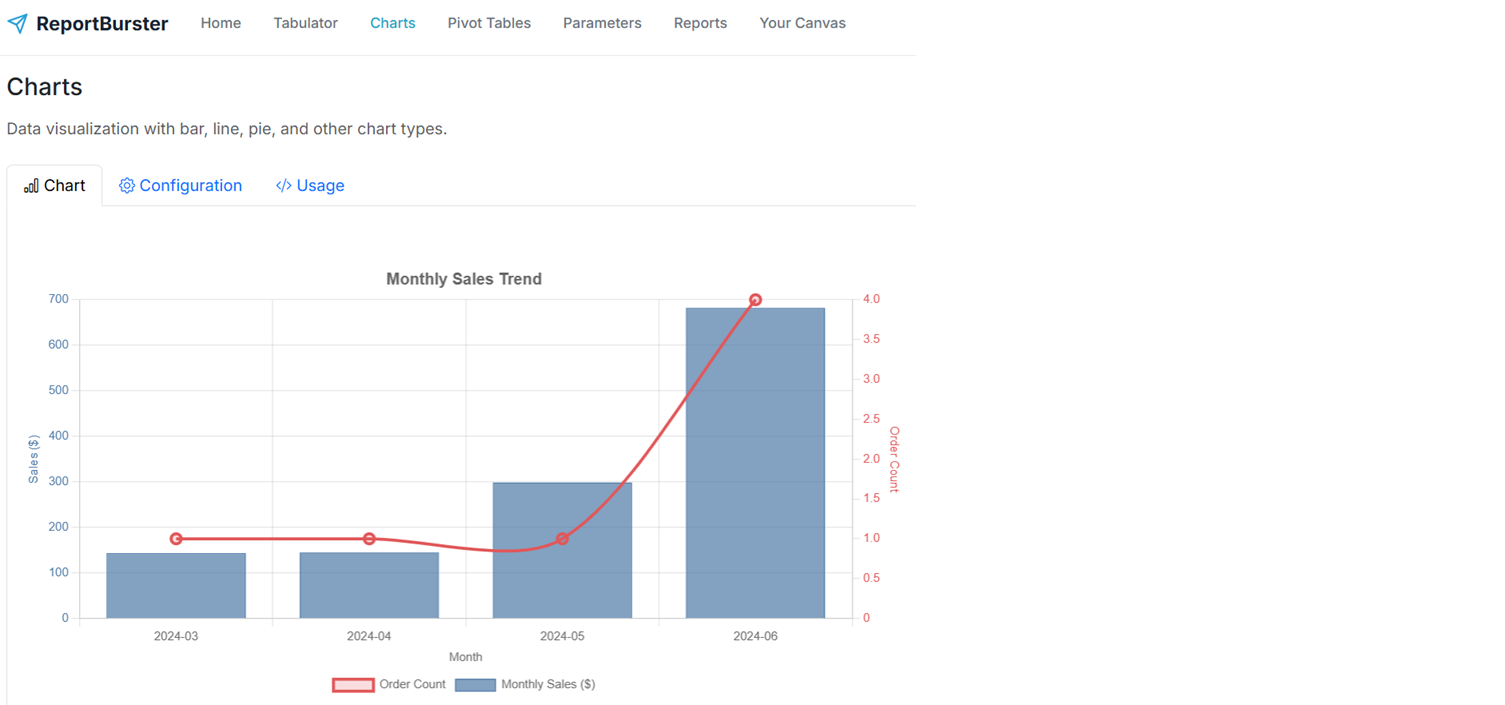
- Charts — bar, line, pie, area, scatter, and more
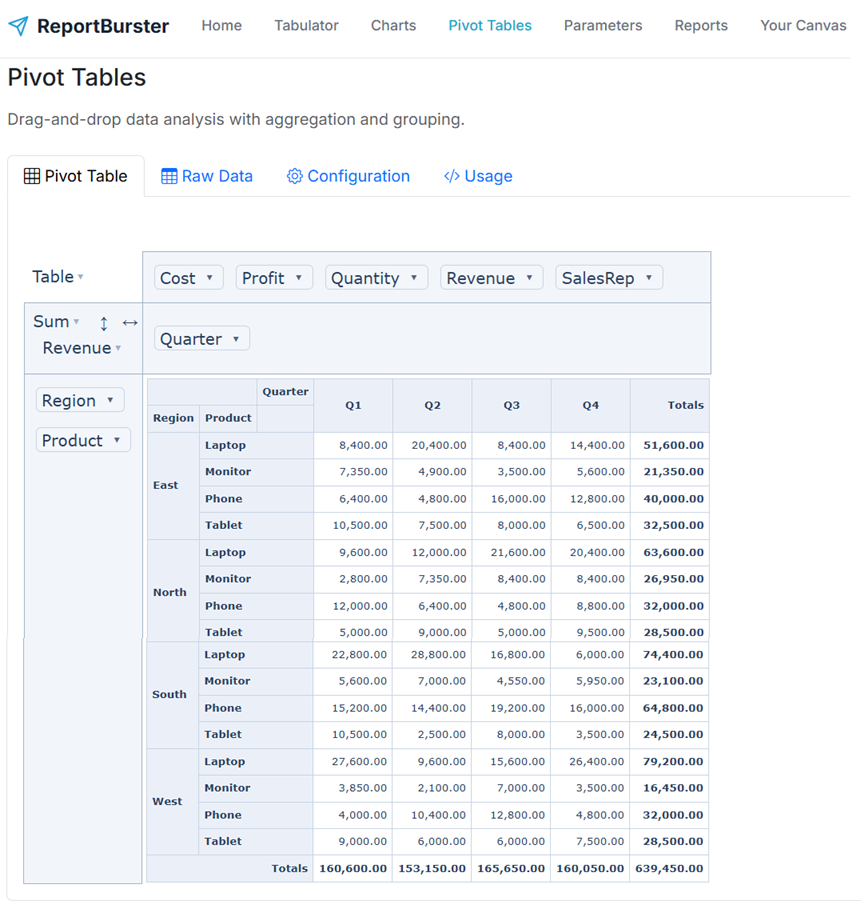
- Pivot Tables — multi-dimensional drag-and-drop analysis
- Report Parameters — dropdowns, date pickers, filters
Step 2: Get the Embed Code
In the report's Usage tab, ReportBurster generates ready-to-use HTML snippets:
| Component | What it does |
|---|---|
<rb-dashboard> | Full dashboard with all embedded components |
<rb-tabulator> | Interactive data table |
<rb-chart> | Chart visualization |
<rb-pivot-table> | Pivot table |
<rb-parameters> | Parameter controls |
<rb-report> | Complete report viewer |
Step 3: Embed Anywhere
Paste the snippet into the FlowKraft Frontend App, or into any web application (plain HTML, WordPress, Angular, Vue, React, etc.). The component connects to ReportBurster, fetches its configuration, and renders automatically.
Web Components
For full details on each component, see Web Components.
Get Started
- Dashboards — step-by-step tutorial to build a dashboard in 5 minutes
- Data Warehouse & OLAP — DuckDB, ClickHouse, and the three-tier OLAP approach
- Performance & Real-Time — caching, componentId optimization, and real-time patterns
- Samples — ready-to-run samples including an interactive dashboard and pivot table