Samples — Try All
Ready-to-run samples — try them all with a single click.
New to ReportBurster? Start with the QuickStart in 5 Minutes guide first.
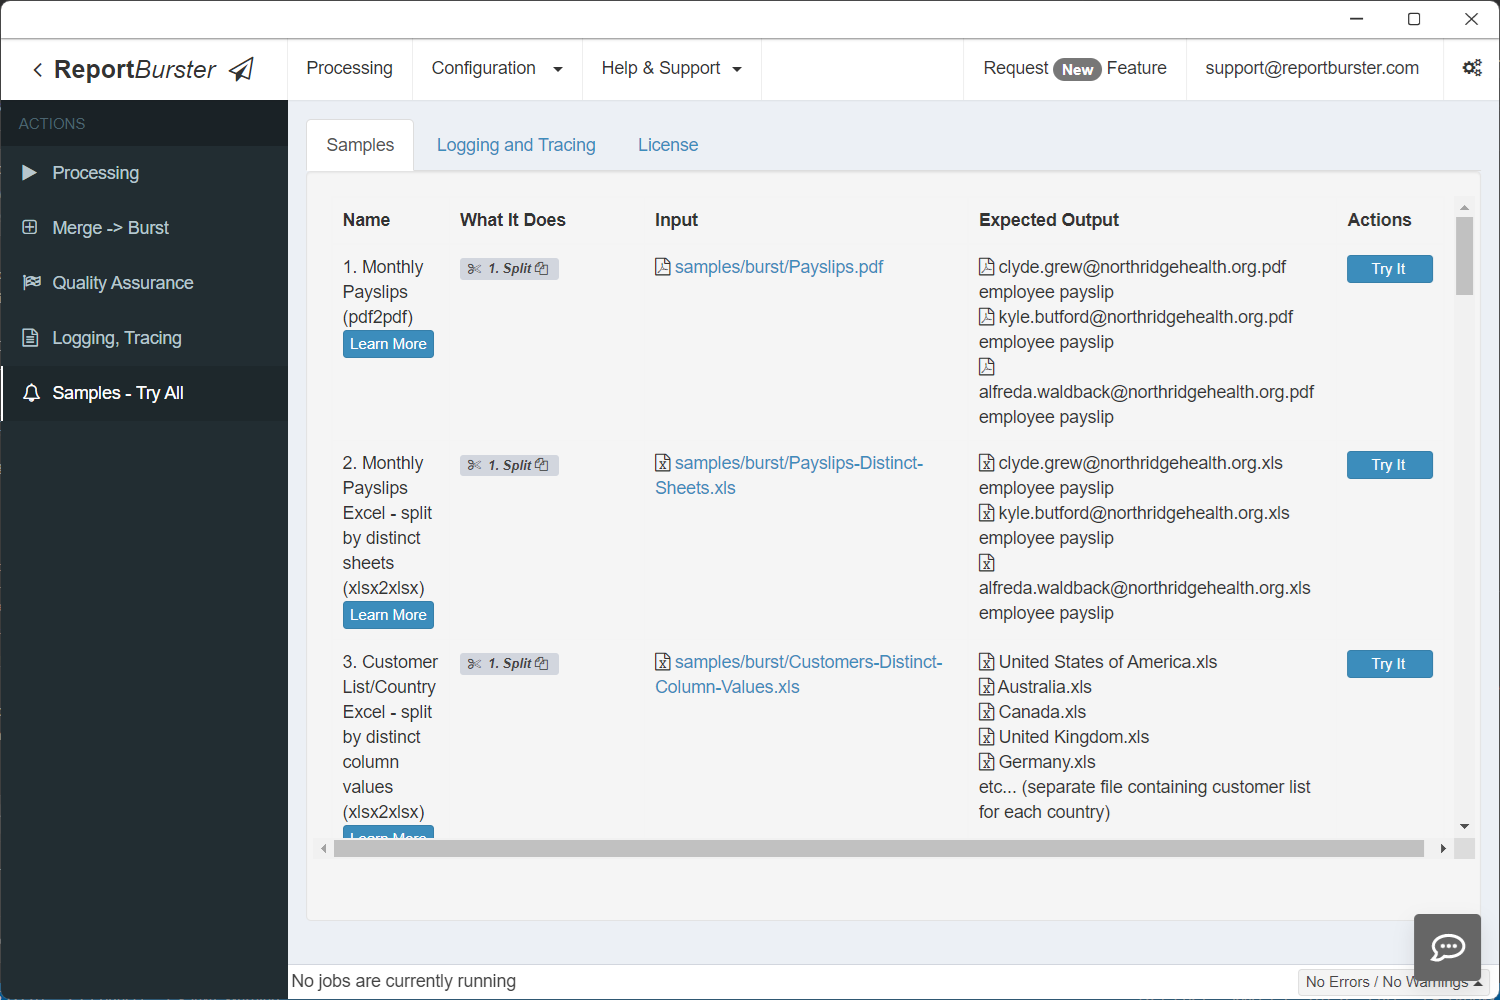
Samples
Report Bursting (PDF & Excel)
1. Burst Monthly PDF Payslips (pdf2pdf)
2. Burst Monthly Excel Payslips by Distinct Sheets (xlsx2xlsx)
3. Burst Customer List Excel by Country (xlsx2xlsx)
4. Burst PDF Invoices for Multiple Customers (pdf2pdf)
5. Merge then Burst Multiple PDF Invoice Files (pdf2pdf)
Report Generation
6. Generate Word Payslips from a CSV Input File (csv2docx)
7. Generate HTML Payslips from a CSV Input File (csv2html)
8. Generate PDF Payslips from a CSV Input File (csv2pdf)
9. Generate Excel Payslips from a CSV Input File (csv2xlsx)
10. Generate Excel Payslips from an Excel Input File (xlsx2xlsx)
11. Generate Student Profiles from a SQL Database (sql2pdf)
12. Generate Customer Statements from a SQL Database (script2html)
13. Customer Sales Summary from a SQL Database (sql2xlsx)
14. Generate Customer Invoices from a SQL Database (script2html)
15. Category-Region Crosstab from a SQL Database (script2html)
16. Monthly Sales Trend from a SQL Database (script2html)
17. Supplier Scorecards from a SQL Database (script2html)
Interactive Dashboard & Pivot Table
Ad-hoc Reports
Report Bursting (PDF & Excel)
1. Burst Monthly PDF Payslips (pdf2pdf)
Payslips.pdf contains three pages for three employees. When bursting, three output PDF files (one page each) are generated — one per employee. You can handle anything from a few dozen to a few thousand documents, and easily email or upload the results.
2. Burst Monthly Excel Payslips by Distinct Sheets (xlsx2xlsx)
Payslips-Distinct-Sheets.xls contains three sheets for three employees. When bursting, three output Excel files (one sheet each) are generated — one per employee.
3. Burst Customer List Excel by Country (xlsx2xlsx)
Customers-Distinct-Column-Values.xls contains one sheet with customer data for 21 countries. When bursting, 21 output Excel files are generated — each containing customer data for the corresponding country.
4. Burst PDF Invoices for Multiple Customers (pdf2pdf)
Split2Times.pdf contains multiple invoices for three customers. A single split per customer produces one PDF with all their invoices bundled together. The Split Once More feature adds a second split by invoice number — so each customer receives separate one-invoice-per-document files.
5. Merge then Burst Multiple PDF Invoice Files (pdf2pdf)
Demonstrates how to merge and process multiple files in one operation. Useful when you have several invoice documents (e.g., from previous months) that need to be merged first, then split and distributed.
Report Generation
6. Generate Word Payslips from a CSV Input File (csv2docx)
Generate payslip documents (Microsoft Word .docx) for all employees using a single CSV text file as datasource.
7. Generate HTML Payslips from a CSV Input File (csv2html)
Generate payslip documents (.html) for all employees using a single CSV text file as datasource.
8. Generate PDF Payslips from a CSV Input File (csv2pdf)
Generate payslip documents (Adobe Acrobat .pdf) for all employees using a single CSV text file as datasource.
9. Generate Excel Payslips from a CSV Input File (csv2xlsx)
Generate payslip documents (Microsoft Excel .xlsx) for all employees using a single CSV text file as datasource.
10. Generate Excel Payslips from an Excel Input File (xlsx2xlsx)
Generate payslip documents (Microsoft Excel .xlsx) for all employees using a single Excel file as datasource.
11. Generate Student Profiles from a SQL Database (sql2pdf)
Generate individualized Student Profile PDF files using an SQL datasource (the Sample Northwind SQLite database). Also demonstrates how to use (Apache) FOP to produce "pixel perfect" PDF reports suitable for high-quality printing and precise layout control.
12. Generate Customer Statements from a SQL Database (script2html)
Generate individualized Customer Statement HTML documents from a SQL datasource (the Sample Northwind SQLite database). The report runs a SQL query that returns one row per customer, and the engine creates one HTML file per customer (e.g., ALFKI.html). Ideal for customer-facing statements, archival exports, or per-customer delivery via email.
13. Customer Sales Summary from a SQL Database (sql2xlsx)
Generate a single consolidated Customer Sales Summary workbook (.xlsx) from a SQL datasource. The report aggregates sales by customer and writes the result to one output Excel file. Ideal when you need one combined report for analysis, archiving, or distribution.
14. Generate Customer Invoices from a SQL Database (script2html)
Generate individualized Invoice HTML files using a scripted datasource. The script builds master-details invoice data and generates one HTML file per OrderID (e.g., invoice_10248.html). Learn scripted data preparation, master/detail rendering, and per-order generation.
15. Category-Region Crosstab from a SQL Database (script2html)
Produce a single HTML Category & Region crosstab using a scripted datasource and the Sample Northwind SQLite database. The script builds a crosstab data structure (categories vs. regions) and renders it to one consolidated file (CategoryRegionCrosstab.html). Suitable for dashboards, exports, or web publishing.
16. Monthly Sales Trend from a SQL Database (script2html)
Generate a single HTML Monthly Sales Trend report using a scripted datasource. The script aggregates monthly sales into a time series and the template renders the trend with embedded charts. Ideal for lightweight executive summaries.
17. Supplier Scorecards from a SQL Database (script2html)
Generate per-supplier HTML Scorecards using a scripted datasource. The script computes KPIs (product counts, pricing, delivery metrics) and the engine generates one file per supplier (e.g., supplier_1_scorecard.html). Learn per-entity generation and mail-merge style outputs for supplier reporting.
Interactive Dashboard & Pivot Table
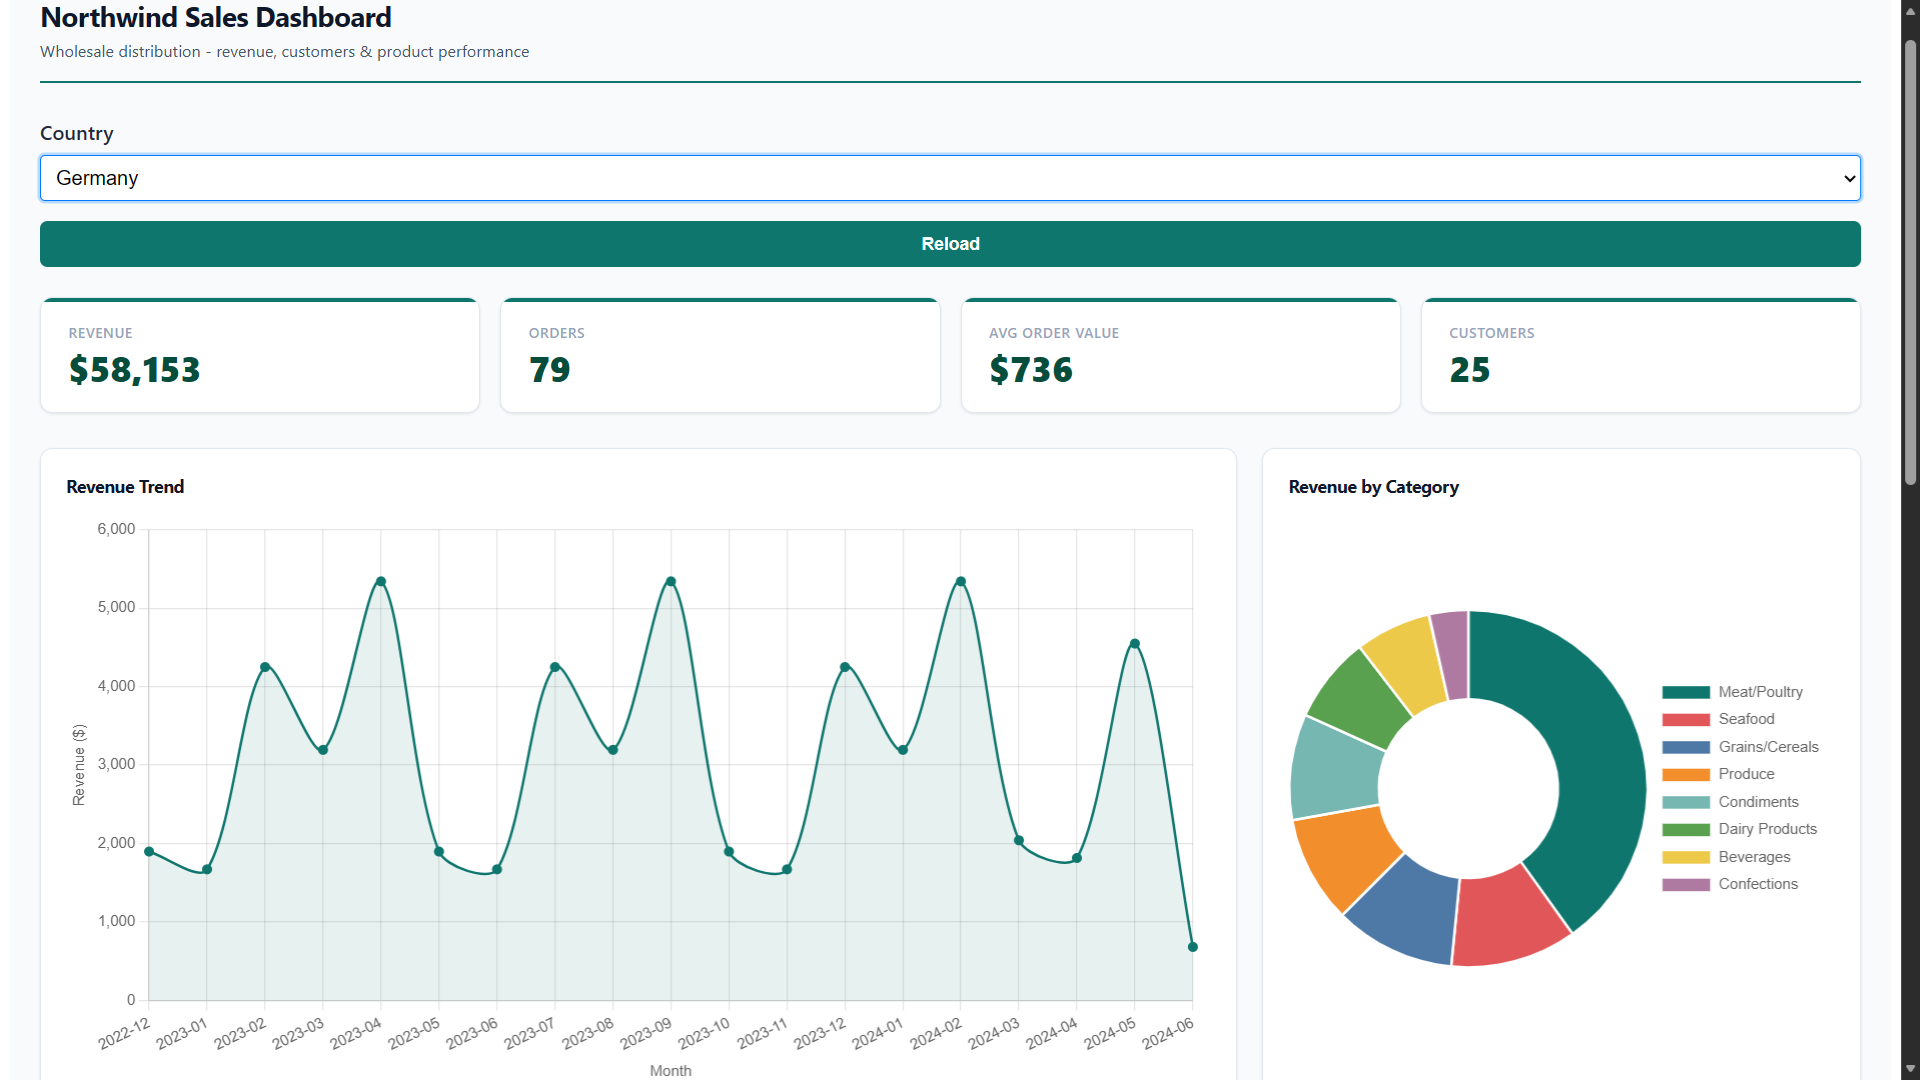
18. Sales Dashboard (interactive)
A ready-to-use Northwind Sales Dashboard — the same dashboard from the Dashboards tutorial. It combines KPI cards, charts, a data table, and a pivot table into a single interactive view powered by the Sample Northwind SQLite database. A Country filter lets you drill down by region.
Click Try It to open the live dashboard in your browser. To build your own, follow the step-by-step tutorial.
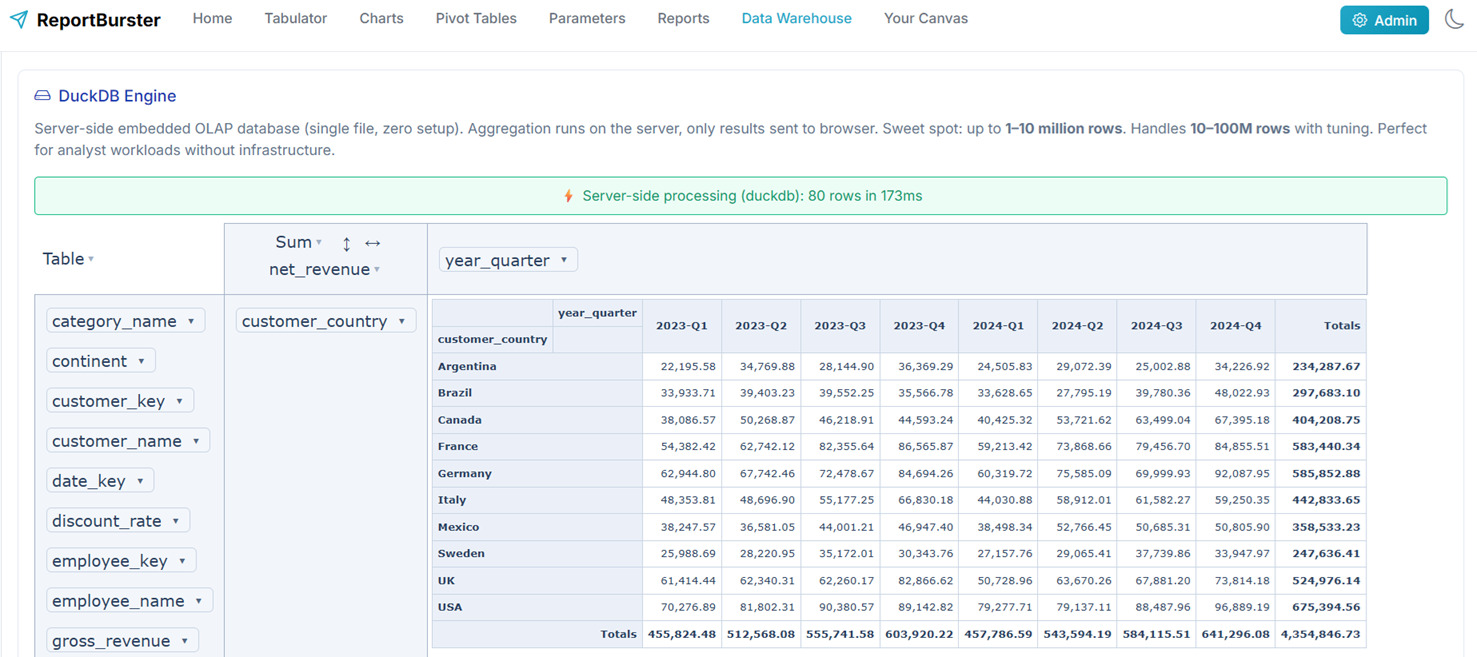
19. Sales PivotTable (data warehouse)
An interactive Pivot Table powered by DuckDB — the "SQLite for analytics". It queries the Northwind data warehouse (~8,000 sales transactions) and lets you drag and drop countries, categories, and quarters to explore revenue from every angle — all aggregation runs server-side in DuckDB for instant results. For even larger data warehouses, ClickHouse scales to billions of rows (learn more).
Click Try It to open the live pivot table in your browser.
Ad-hoc Reports
20. Ad-hoc Employee Profile (script2pdf)
Demonstrates ad-hoc report generation using report parameters — no database or file datasource needed. The user fills in parameter values (EmployeeID, FirstName, LastName) via the report parameters form in the UI, and the Groovy script reads them to produce a PDF via an XSL-FO template. Learn how to define report parameters with default values and generate one-off documents (certificates, badges, invoices) from form values alone.