Database Connections
Configure database connections in ReportBurster to explore schemas, visualize relationships, and build a shared understanding of your data.
Table of Contents
- Why Database Connections Matter
- Supported Databases
- Creating a Connection
- Database Schema
- Domain-Grouped Schema
- ER Diagram
- Ubiquitous Language
Why Database Connections Matter
In ReportBurster, a database connection is more than a set of login credentials. It is the starting point for understanding your data — and understanding your data is the foundation for everything else: generating reports, building dashboards, distributing documents, and making informed decisions.
When you create a database connection, ReportBurster automatically fetches the database schema and opens up a set of tools for exploring, organizing, and visualizing the data model behind your enterprise systems.
Supported Databases
ReportBurster connects to all major database systems:
- Oracle
- SQL Server
- PostgreSQL
- MySQL
- MariaDB
- IBM Db2
- SQLite
- DuckDB (Analytics/OLAP)
- ClickHouse (Analytics/OLAP)
- Supabase (PostgreSQL BaaS)
Notice the DuckDB and ClickHouse entries — these are analytical/OLAP databases designed for fast aggregation over large datasets. ReportBurster supports them natively, so you can connect to your analytical data stores alongside your operational databases.
Creating a Connection
Go to Configuration -> Connections (Email, Databases) in the top menu.
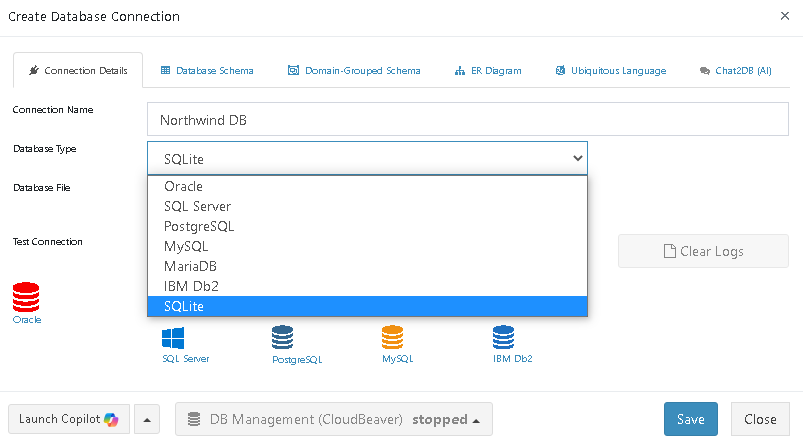
Enter a connection name, select the database type, and fill in the usual connection details (host, port, database, username, password). Then click Test Connection & Fetch Database Schema.
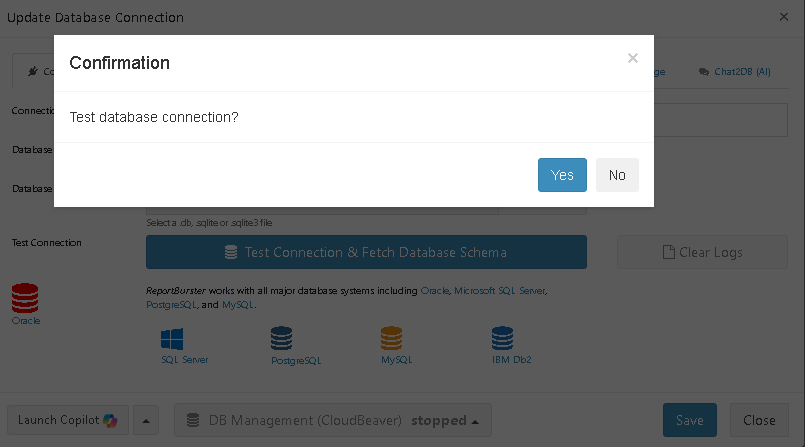
ReportBurster verifies the connection and retrieves the complete database schema — all tables, columns, indexes, and metadata — storing it for ongoing use. This is the moment where a simple login becomes a window into your data.
Database Schema
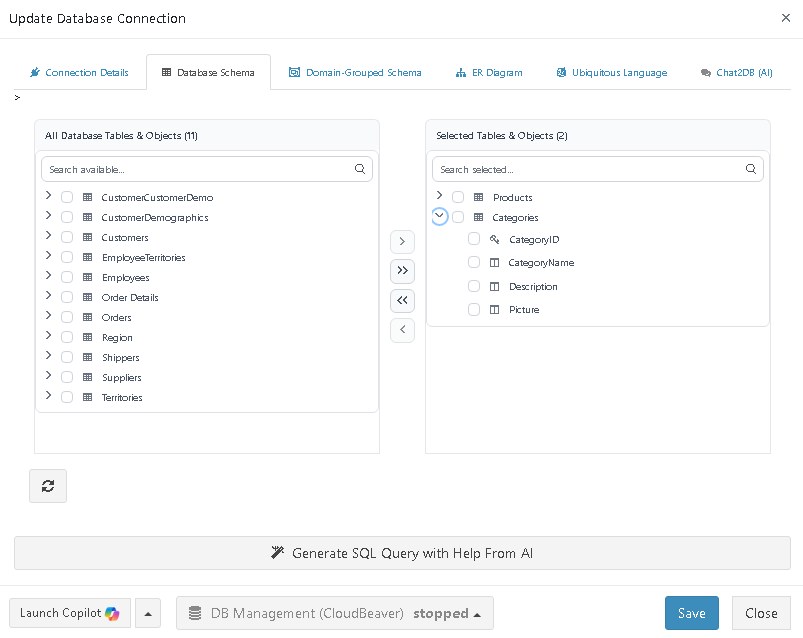
The Database Schema tab displays every table and column discovered in your database. This raw schema is the foundation — you can see exactly what data is available and start forming a mental model of the system.
But a flat list of tables only tells you so much. The next step is to organize them.
Domain-Grouped Schema
Raw database schemas can contain dozens or hundreds of tables. Without context, it is difficult to know which tables relate to sales, which to HR, and which to inventory. The Domain-Grouped Schema addresses this by organizing tables into meaningful business areas.
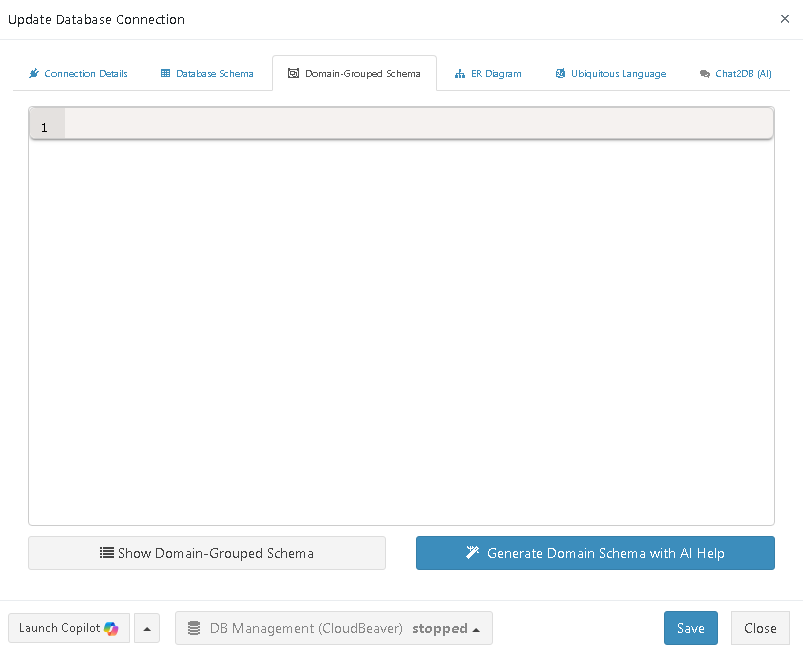
Click Generate Domain Schema with AI Help and ReportBurster prepares an AI prompt that includes your full schema. Copy this prompt to your preferred AI provider.
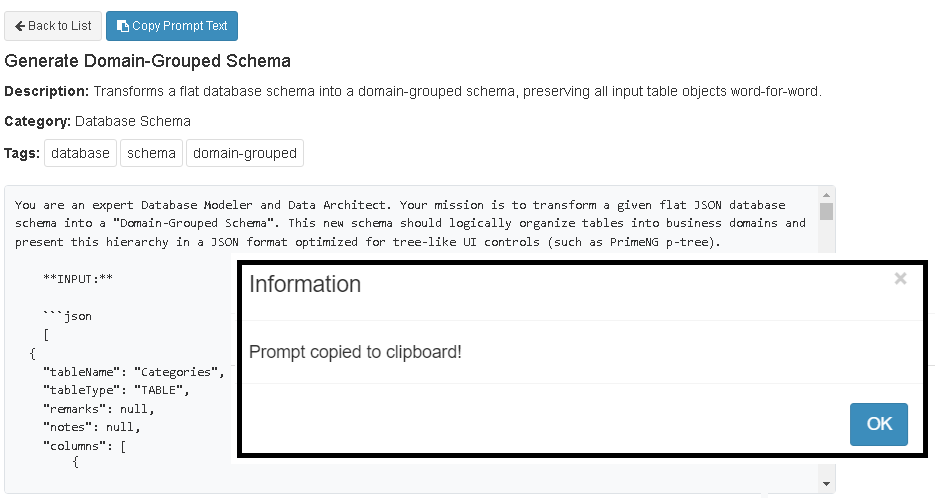
The AI returns your tables grouped by business domain. Save the result in ReportBurster.
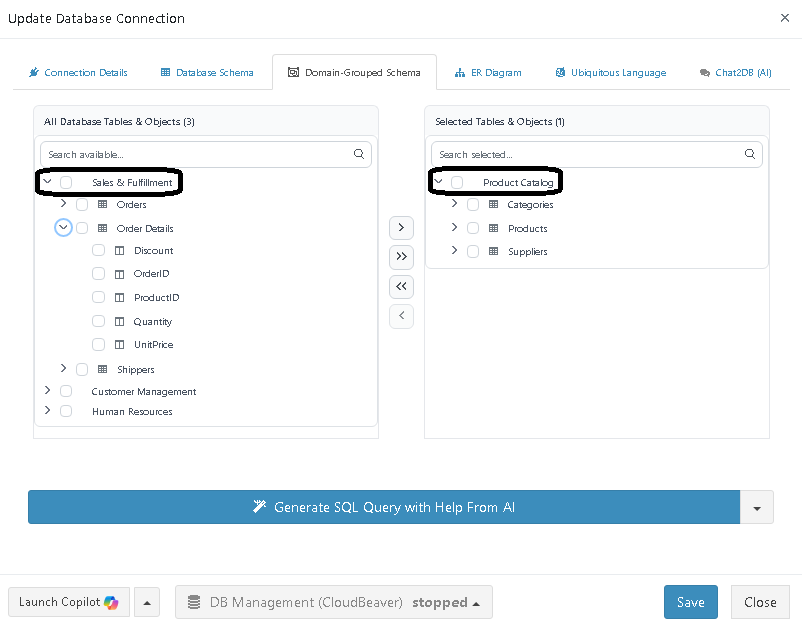
Now instead of a flat list, you see domains like "Sales & Fulfillment" and "Product Catalog" — each containing the relevant tables. When it is time to build a report or write a query, you know exactly where to look.
The grouping does not need to be perfect. It needs to be useful. You can always refine it later as your understanding deepens.
ER Diagram
Understanding which tables exist and which domain they belong to is valuable. Understanding how they relate to each other is even more valuable. The ER Diagram tab generates a visual entity-relationship diagram of your database.
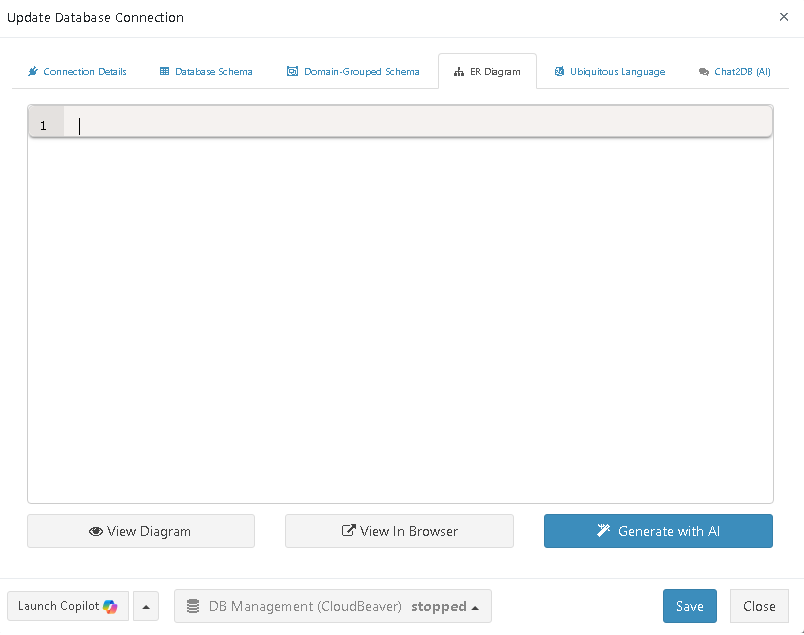
Click Generate with AI and pass the provided prompt to your AI provider.
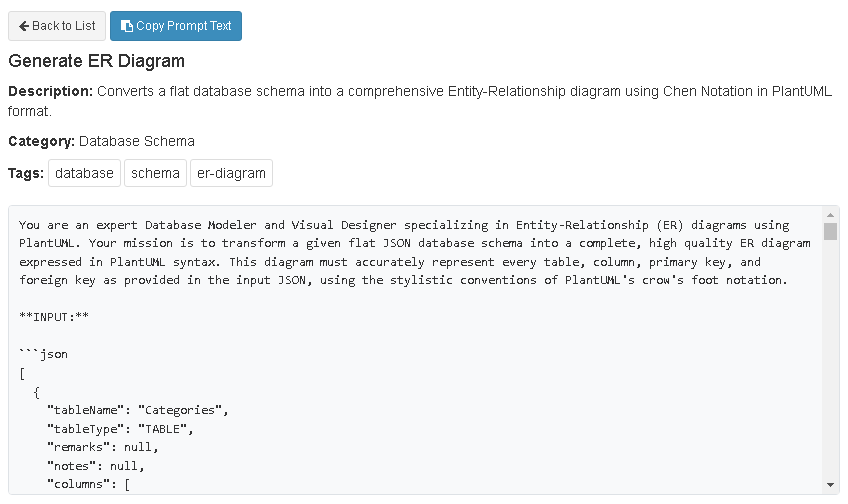
The result is a visual diagram showing tables, their columns, and the relationships between them.
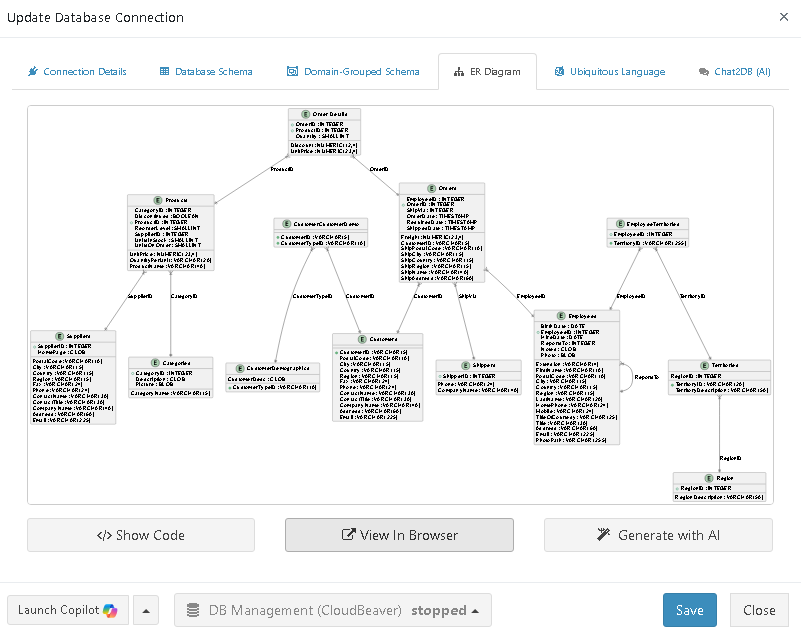
You can view the diagram in the browser for a full-screen, interactive experience.
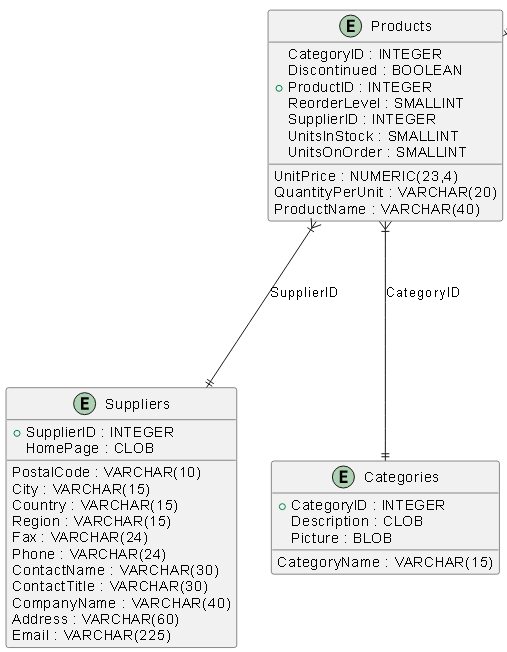
An ER diagram turns abstract table names into a map of your data. Foreign keys, join paths, and one-to-many relationships become visible at a glance — exactly the kind of understanding you need before writing queries or designing reports.
Ubiquitous Language
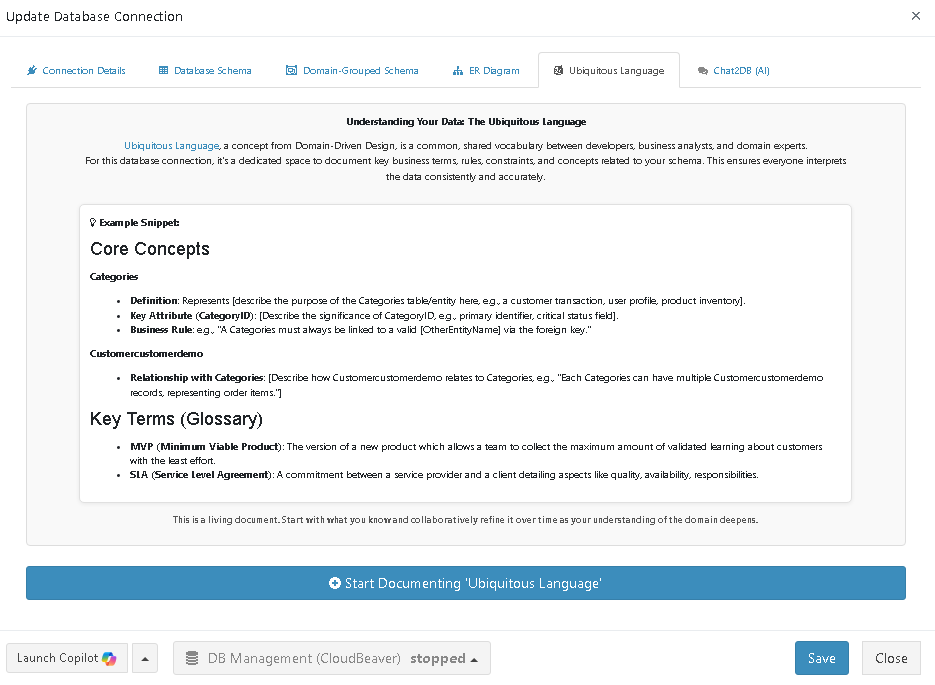
The Ubiquitous Language tab borrows a concept from Domain-Driven Design: a shared vocabulary that both technical and business people use to describe the same things in the same way. When "Customer" means the same thing to a developer, a report designer, and a sales manager, miscommunication drops and report accuracy goes up.
This is the one place where you should invest your own thinking rather than delegating entirely to AI. The real value lies in the process of defining and agreeing on these terms with your team. Document the business rules, definitions, and concepts that matter to your organization — what counts as an "active customer," what "revenue" includes, when an order is considered "fulfilled."
The result is a living reference that makes every subsequent step — querying data, building reports, designing dashboards — grounded in a shared understanding of the business.