Embed Web Components
Embed data-driven reports, tables, charts, and pivot tables in any web application using ReportBurster web components.
Table of Contents
Overview
ReportBurster provides five data-driven web components that you can embed in any web application. These are standard HTML custom elements that work everywhere—no framework required.
Each component connects to your ReportBurster server, fetches its configuration and data automatically, and renders interactive visualizations.
Key benefits:
- Works with any web application (plain HTML, WordPress, Angular, Vue, React, etc.)
- No build tools or package managers needed
- Configuration is managed centrally in ReportBurster
FlowKraft Apps: The FlowKraft Frontend App (
_apps/flowkraft/*) has these web components pre-configured. Just paste your embed code—no script setup required. See FlowKraft Frontend App to get started.
Available Components
| Component | Description |
|---|---|
<rb-report> | Complete report viewer with parameters and all visualizations |
<rb-tabulator> | Interactive data table with sorting, filtering, and pagination |
<rb-chart> | Charts (bar, line, pie, area, scatter, and more) |
<rb-pivot-table> | Pivot tables for multi-dimensional data analysis |
<rb-parameters> | Parameter form for user input (dates, dropdowns, etc.) |
All components use the same attributes:
| Attribute | Required | Description |
|---|---|---|
report-code | Yes | Report folder name (e.g., "sales-summary") |
api-base-url | Yes | Base URL for API (e.g., "http://localhost:9090/api/jobman/reporting") |
api-key | Optional | API key for authentication |
Configure Your Web Components
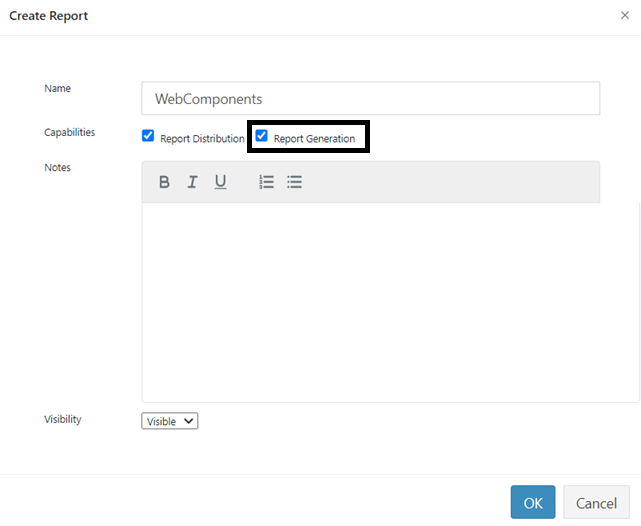
Step 1: Create a Report
Go to Configuration → Reports → New Report.
Enter a name and select the Report Generation checkbox.
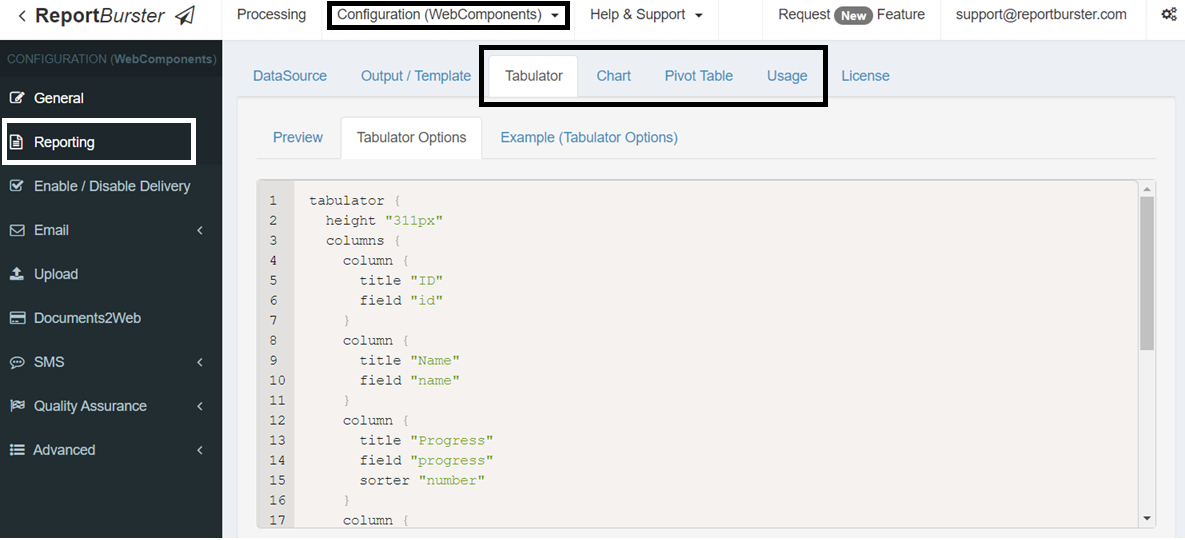
Step 2: Configure Visualizations
Once created, go to Configuration (Your Report Name) → Reporting in the left menu.
The tabs — DataSource, Tabulator, Chart, Pivot Table, and Usage — let you define your data source, configure each visualization type, and copy the embed code.
How to Embed
For FlowKraft Frontend App (Recommended)
If you're using the FlowKraft Frontend App, the web components script is already configured. Simply:
- Configure your report in ReportBurster
- Go to the Usage tab and copy the embed code
- Paste it into your FlowKraft app view
That's it! No additional setup required.
For Other Web Applications
For custom applications or third-party platforms:
Step 1: Get the Embed Code
In the report configuration, go to the Usage tab. ReportBurster generates ready-to-use HTML snippets for each component.
Step 2: Include the Script
Add the web components script to your HTML page:
<script src="http://localhost:9090/rb-webcomponents.umd.js"></script>Step 3: Paste the Component
Copy the embed code and paste it into your HTML:
<rb-tabulator
  report-code="sales-summary"
  api-base-url="http://localhost:9090/api/jobman/reporting">
</rb-tabulator>The component automatically fetches configuration and data from the server.
Basic Usage
Data Table
<rb-tabulator
  report-code="monthly-sales"
  api-base-url="http://localhost:9090/api/jobman/reporting">
</rb-tabulator>Chart
<rb-chart
  report-code="revenue-trend"
  api-base-url="http://localhost:9090/api/jobman/reporting"
  style="height: 400px;">
</rb-chart>Pivot Table
<rb-pivot-table
  report-code="sales-analysis"
  api-base-url="http://localhost:9090/api/jobman/reporting">
</rb-pivot-table>Full Report
<rb-report
  report-code="employee-payslips"
  api-base-url="http://localhost:9090/api/jobman/reporting">
</rb-report>Learn More
Each component has dedicated documentation with detailed configuration options:
- Data Tables - Interactive data grids
- Charts - Data visualization charts
- Pivot Tables - Multi-dimensional analysis
- Report Parameters - User input controls
- Reports - Complete report viewer