ReportBurster v12: Embeddable Analytics Have Arrived
Jack
ReportBurster has long been the leader in report bursting and report distribution.
We expanded into report generation and a self‑service document portal—and now, with this release, we are completing the picture. You can now publish reports to interactive dashboards where users can truly explore and visualize the data.
We follow a simple guiding principle: make it as effortless as possible for users to build exactly what they need.
With v12, ReportBurster finally closes the loop:
- Report Generation
- Report Bursting & Distribution
- Self‑Service Portal
- Embeddable Analytics
All in one, self‑hosted platform.
On top of this, we have added just enough AI to help you build better reports without replacing your expertise.
ReportBurster's AI assists you in understanding your data, configuring sources, and generating SQL and automation scripts—while you stay firmly in control.
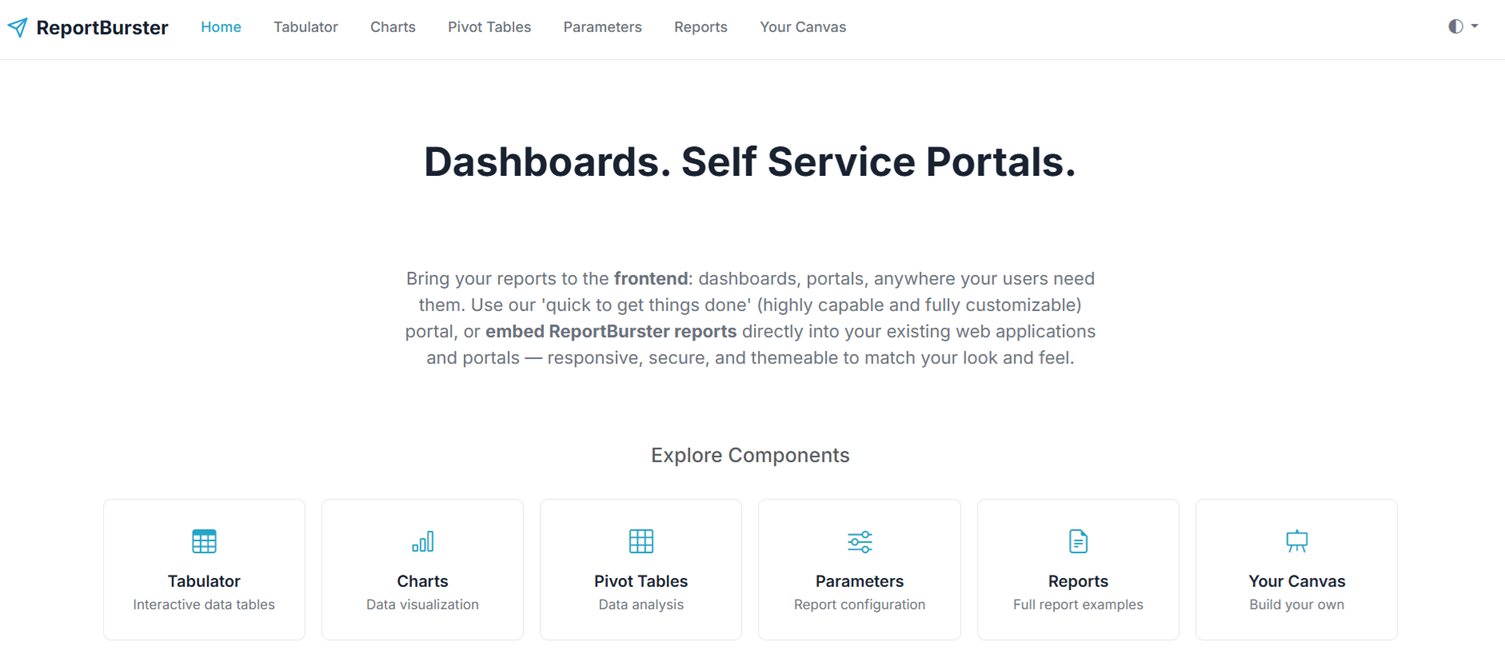
What You Can Build
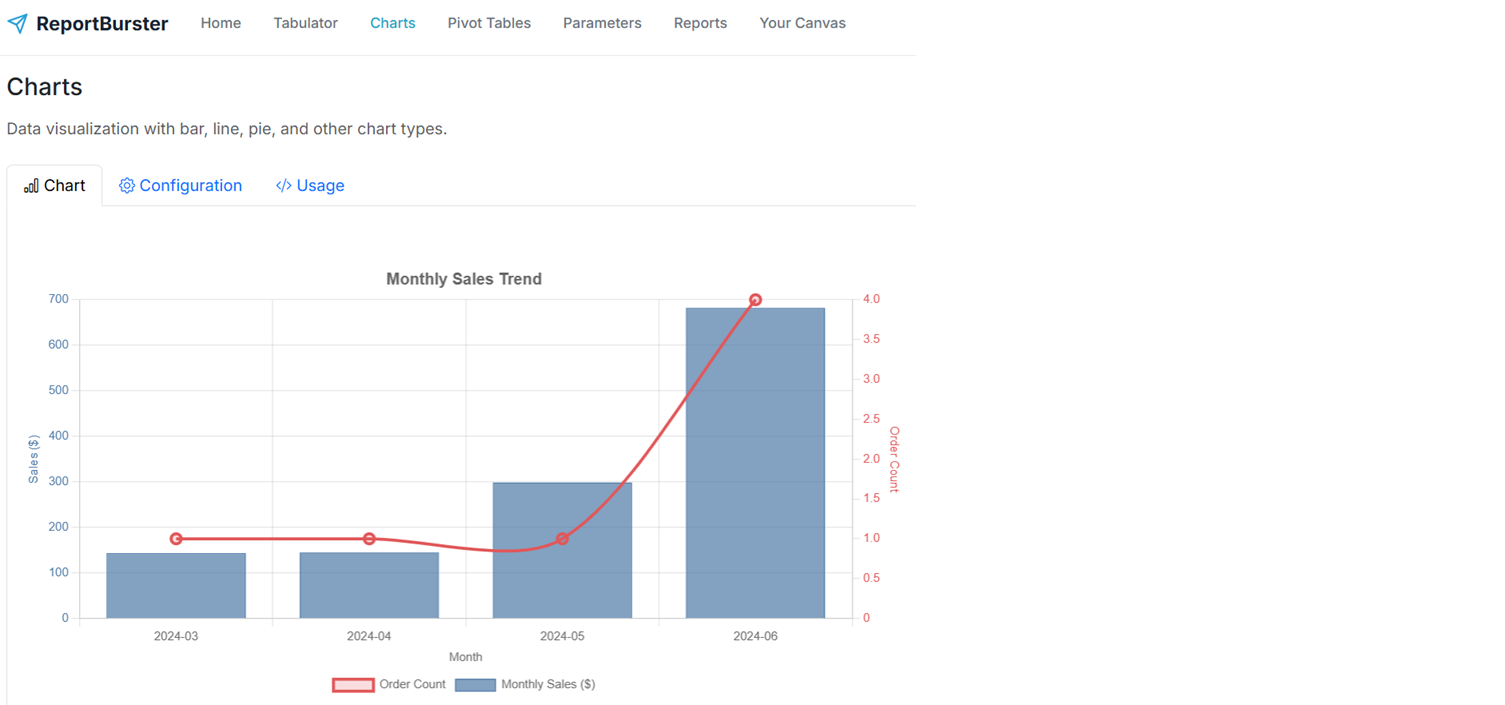
- BI Dashboards: Combine charts, tables, and parameter controls into interactive, live dashboards.
- Data-Driven Web Components: Seamlessly drop
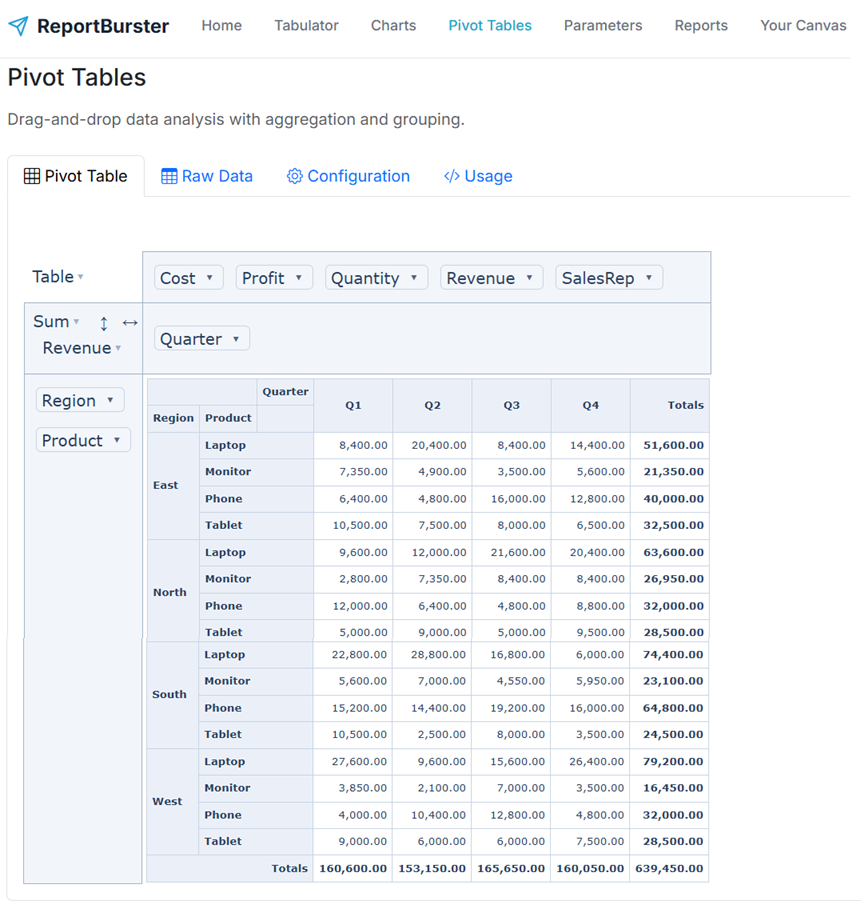
rb-chart,rb-tabulator,rb-pivot-table,rb-parameters, orrb-reportinto any page or CMS block. - Self‑Service Portal: Publish document-focused views and portals tailored specifically for end users.
FlowKraft Frontend App — Dashboards in Minutes
Taking the same approach as our Self‑Service Document Portal, the FlowKraft Frontend App is a "ready-to-go" prebuilt application oriented around dashboards. Simply bring your reports, drop in the components, and apply your branding.
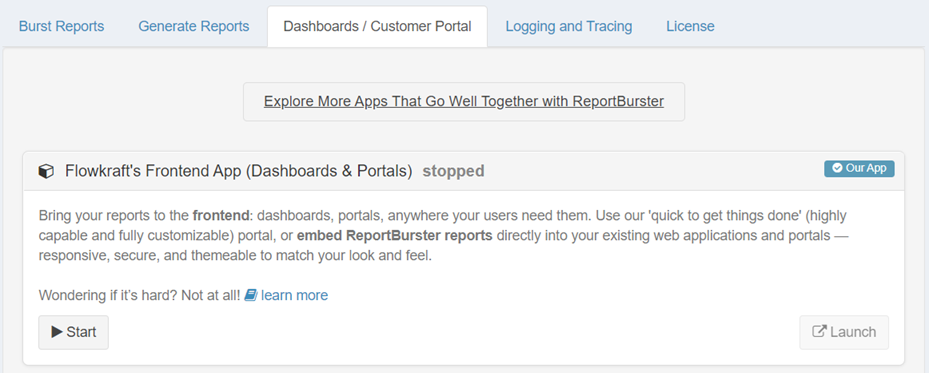
Get started immediately by previewing the examples:
- Launch the FlowKraft Frontend App from the Apps menu in ReportBurster.
- Open the app to explore the library of example dashboards and components.
- Swap in your own reports, arrange the layout, and publish.
The app comes pre‑configured with ReportBurster's web components, so you can focus on the data and design rather than wiring everything together from scratch.
Why the name FlowKraft Frontend App? FlowKraft is the company behind ReportBurster — the app provides the tools to craft your data flows and dashboards.
When You’d Use This
- Executive Dashboards: Build a high-level overview with a few
rb-chartcomponents—fast and without extra hosting. - Modernize Internal Tools: Replace stale Excel exports with interactive tables and pivot views inside your existing internal apps.
Integration With Your Existing Web Applications
Our web components are framework-agnostic and embed directly into your existing stack. Whether you are using React, Angular, Vue, Svelte, WordPress, or plain HTML, integration is seamless.
Drop rb-chart, rb-tabulator, rb-pivot-table, rb-parameters, or rb-report into any page, dashboard, or CMS block. Each component fetches its configuration from your ReportBurster instance and renders automatically, instantly giving your applications full business‑intelligence functionality.
Try it
Curious how to start? Our QuickStart Guide walks you through creating a report and embedding it in minutes.
Like what you see but too busy to set it up yourself? We'll do it for you — just tell us what you need.
From simple setup and configuration walkthroughs, to building custom reports, to deploying fully custom document portals and BI dashboards — we handle it all.
Don't want to deal with infrastructure? We host the whole solution. You'll just log in as admin and enjoy fully automated document workflows.