Build a Business Intelligence Dashboard Over Your IBM DB2 Database
Virgil
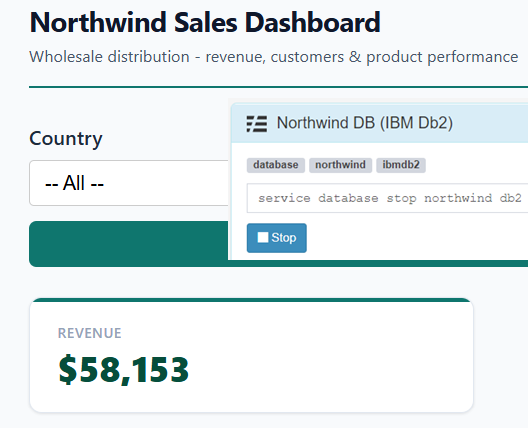
We recently published a detailed Dashboards tutorial that walks you through building a full Northwind Sales Dashboard — KPI cards, revenue charts, a data table, a pivot table, and a country filter — all powered by the built-in SQLite database. If you haven't seen it yet, it's the definitive guide to building BI dashboards with ReportBurster.
But here's the thing: enterprise data lives in databases like Oracle, SQL Server, IBM DB2, PostgreSQL, and MySQL — not SQLite. The good news? Switching to any of them only means adapting the SQL to your vendor's dialect. Everything else — the dashboard template, the charts, the tabulator, the pivot table — stays exactly the same. Today we'll prove it with IBM DB2.
Setting Up the IBM DB2 Starter Pack
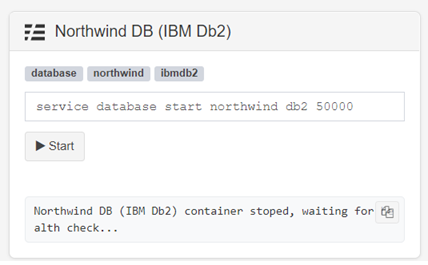
ReportBurster ships with an IBM DB2 Starter Pack — a Docker container preloaded with the same Northwind data used in the SQLite tutorial. To get it running:
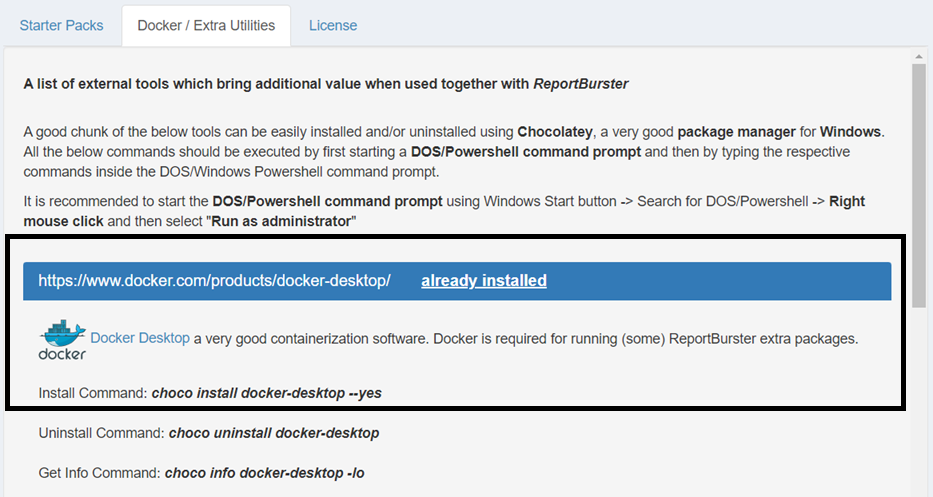
Note: Docker must be installed. Installation instructions are available under Help & Support → Starter Packs / Extra Utils → Docker / Extra Utilities.
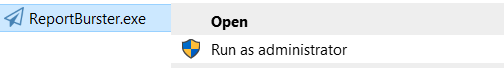
Once Docker is ready, restart ReportBurster.exe, right-click it and Run as Administrator (needed to manage Docker containers)
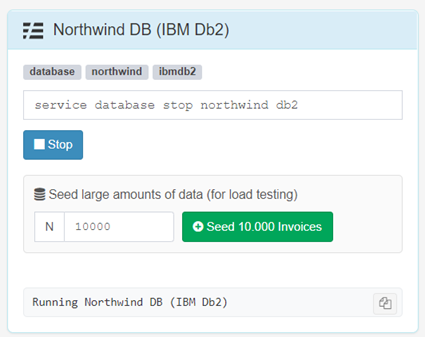
Then go to Help & Support → Starter Packs / Extra Utils and start the IBM DB2 sample
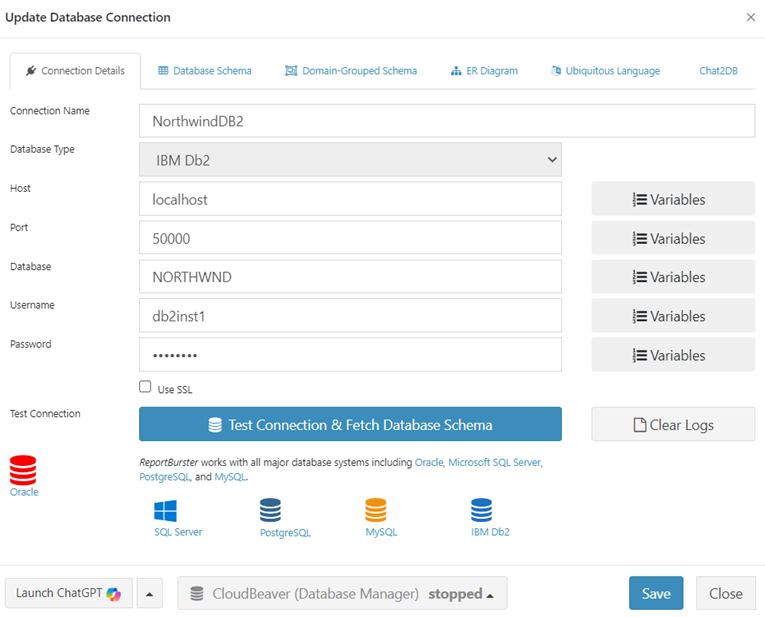
Connecting to DB2
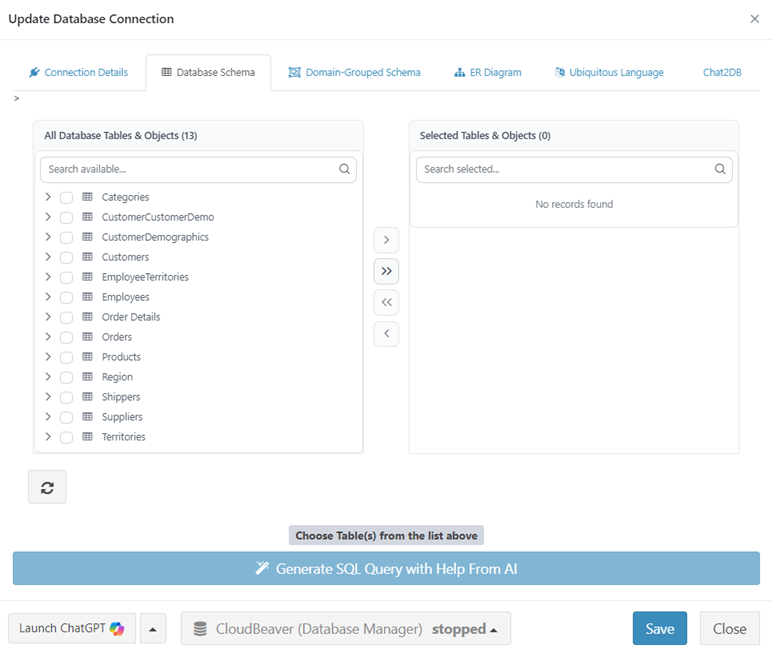
Head to Configuration → Connections (Email, Databases) and set up the IBM DB2 connection. Click Test Connection & Fetch Database Schema to confirm everything works.
The Only Thing That Changes: The SQL
If you follow the tutorial above, you'll set up a report with a datasource script, parameters, an HTML template, and component configurations (tabulator, charts, pivot table). For the DB2 version, the HTML template and all component configurations are identical — copy them straight from the tutorial. The only thing that needs adapting is the data script and the parameters script, because DB2 speaks a slightly different SQL dialect.
Every SQL vendor has its own dialect. For DB2 the changes are:
- Date formatting —
VARCHAR_FORMAT(o."OrderDate", 'YYYY-MM')instead of SQLite'sSTRFTIME - Rounding —
DECIMAL(value, 12, 0)instead ofROUND - Row limiting —
FETCH FIRST 10 ROWS ONLYinstead ofLIMIT 10 - Quoted identifiers everywhere — DB2 uppercases unquoted names, so tables (
"Orders","Order Details"), columns ("ShipCountry","OrderDate"), and aliases (AS "revenue",AS "month") all need double quotes to preserve mixed case - FROM clause for constants —
SELECT '-- All --' FROM SYSIBM.SYSDUMMY1because DB2 doesn't allow bare SELECT without FROM
You don't need to figure out these translations yourself. Just paste the SQLite script from the tutorial into ChatGPT, Claude, or your preferred LLM chat and ask "this script uses SQLite SQL — convert all the SQL parts to IBM DB2 syntax." You'll get a working result in seconds. That's exactly how the scripts below were produced.
The Adapted Data Script
import groovy.sql.Sql

def dbSql = ctx.dbSql
def componentId = ctx.variables?.get('componentId')

// Get filter parameters
def userVars = ctx.variables.getUserVariables(ctx.token ?: '')
def country = userVars?.get('country')?.toString()
def filterByCountry = country && country != 'null' && country != 'All' && country != '-- All --' && country.trim() != ''

log.info("Dashboard params - componentId: {}, country: {}, filterByCountry: {}", componentId, country, filterByCountry)

// KPI base query (shared WHERE clause)
// Note: DB2 table/column names created with mixed case must be double-quoted
// Note: DB2 uppercases unquoted column aliases — quote aliases to preserve lowercase for frontend
def kpiBase = """
    FROM "Orders" o
    JOIN "Order Details" od ON o."OrderID" = od."OrderID"
"""
if (filterByCountry) kpiBase += " WHERE o.\"ShipCountry\" = '${country}'"

// Component: atomicValues — single query returning all 4 KPI values as columns
if (!componentId || componentId == 'atomicValues') {
    def data = dbSql.rows("""
        SELECT
            DECIMAL(SUM(od."UnitPrice" * od."Quantity" * (1 - od."Discount")), 12, 0) AS "revenue",
            COUNT(DISTINCT o."OrderID") AS "orders",
            DECIMAL(SUM(od."UnitPrice" * od."Quantity" * (1 - od."Discount")) / COUNT(DISTINCT o."OrderID"), 12, 0) AS "avgOrderValue",
            COUNT(DISTINCT o."CustomerID") AS "customers"
    """ + kpiBase)
    ctx.reportData('atomicValues', data)
}

// Component: revenueTrend (Chart — monthly revenue)
if (!componentId || componentId == 'revenueTrend') {
    def sql = """
        SELECT
            VARCHAR_FORMAT(o."OrderDate", 'YYYY-MM') AS "month",
            DECIMAL(SUM(od."UnitPrice" * od."Quantity" * (1 - od."Discount")), 12, 0) AS "revenue"
        FROM "Orders" o
        JOIN "Order Details" od ON o."OrderID" = od."OrderID"
        WHERE o."OrderDate" IS NOT NULL
    """
    if (filterByCountry) sql += " AND o.\"ShipCountry\" = '${country}'"
    sql += " GROUP BY VARCHAR_FORMAT(o.\"OrderDate\", 'YYYY-MM') ORDER BY \"month\""
    def data = dbSql.rows(sql)
    ctx.reportData('revenueTrend', data)
}

// Component: revenueByCategory (Chart — revenue per product category)
if (!componentId || componentId == 'revenueByCategory') {
    def sql = """
        SELECT
            c."CategoryName" AS "category",
            DECIMAL(SUM(od."UnitPrice" * od."Quantity" * (1 - od."Discount")), 12, 0) AS "revenue"
        FROM "Order Details" od
        JOIN "Products" p ON od."ProductID" = p."ProductID"
        JOIN "Categories" c ON p."CategoryID" = c."CategoryID"
        JOIN "Orders" o ON od."OrderID" = o."OrderID"
    """
    if (filterByCountry) sql += " WHERE o.\"ShipCountry\" = '${country}'"
    sql += " GROUP BY c.\"CategoryName\" ORDER BY \"revenue\" DESC"
    def data = dbSql.rows(sql)
    ctx.reportData('revenueByCategory', data)
}

// Component: topCustomers (Tabulator — top 10 by revenue)
if (!componentId || componentId == 'topCustomers') {
    def sql = """
        SELECT
            cu."CompanyName" AS "company",
            cu."Country" AS "country",
            cu."ContactName" AS "contact",
            COUNT(DISTINCT o."OrderID") AS "orders",
            DECIMAL(SUM(od."UnitPrice" * od."Quantity" * (1 - od."Discount")), 12, 2) AS "revenue"
        FROM "Customers" cu
        JOIN "Orders" o ON cu."CustomerID" = o."CustomerID"
        JOIN "Order Details" od ON o."OrderID" = od."OrderID"
    """
    if (filterByCountry) sql += " WHERE o.\"ShipCountry\" = '${country}'"
    sql += " GROUP BY cu.\"CustomerID\", cu.\"CompanyName\", cu.\"Country\", cu.\"ContactName\" ORDER BY \"revenue\" DESC FETCH FIRST 10 ROWS ONLY"
    def data = dbSql.rows(sql)
    ctx.reportData('topCustomers', data)
}

// Component: orderExplorer (Pivot Table — orders by country, category, year)
if (!componentId || componentId == 'orderExplorer') {
    def sql = """
        SELECT
            o."ShipCountry" AS "country",
            c."CategoryName" AS "category",
            VARCHAR_FORMAT(o."OrderDate", 'YYYY') AS "year",
            DECIMAL(SUM(od."UnitPrice" * od."Quantity" * (1 - od."Discount")), 12, 2) AS "revenue",
            SUM(od."Quantity") AS "quantity"
        FROM "Orders" o
        JOIN "Order Details" od ON o."OrderID" = od."OrderID"
        JOIN "Products" p ON od."ProductID" = p."ProductID"
        Join "Categories" c ON p."CategoryID" = c."CategoryID"
        WHERE o."OrderDate" IS NOT NULL
    """
    if (filterByCountry) sql += " AND o.\"ShipCountry\" = '${country}'"
    sql += " GROUP BY o.\"ShipCountry\", c.\"CategoryName\", VARCHAR_FORMAT(o.\"OrderDate\", 'YYYY') ORDER BY \"country\", \"category\", \"year\""
    def data = dbSql.rows(sql)
    ctx.reportData('orderExplorer', data)
}The Adapted Parameters Script
The parameters script also contains SQL, so it needs the same dialect treatment. Again — let your LLM handle it:
reportParameters {
    parameter(
        id: 'country',
        type: String,
        label: 'Country',
        defaultValue: '-- All --'
    ) {
        constraints(required: false)
        ui(
            control: 'select',
            options: "SELECT '-- All --' AS \"ShipCountry\" FROM SYSIBM.SYSDUMMY1 UNION ALL SELECT DISTINCT \"ShipCountry\" FROM \"Orders\" WHERE \"ShipCountry\" IS NOT NULL ORDER BY \"ShipCountry\""
        )
    }
}The Result
Same dashboard. Same KPI numbers. Same charts, same data table, same pivot table. Just powered by IBM DB2 instead of SQLite.
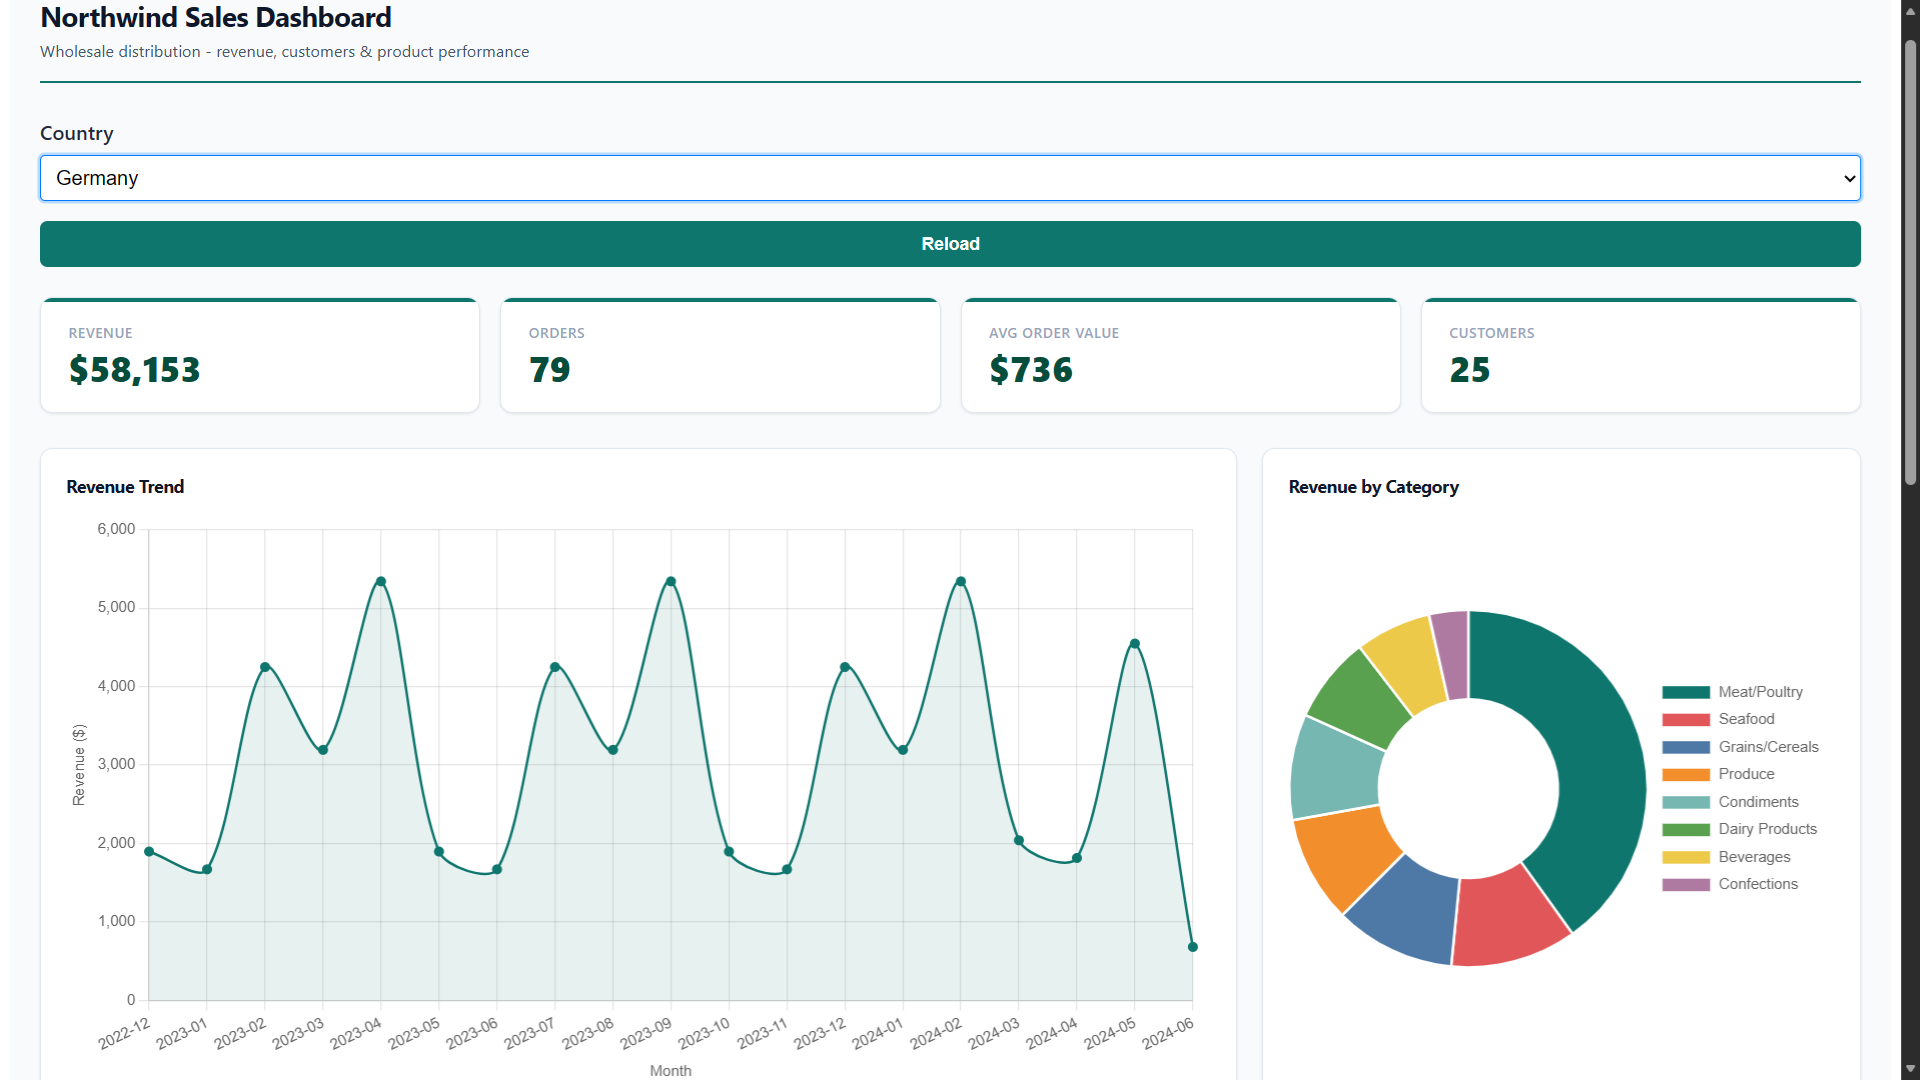
Since the Northwind data is identical in both databases, every number matches — which is exactly the point. The dashboard layer is completely database-agnostic. The rb-* web components don't know or care whether the data came from DB2, SQLite, or anything else.
This Works for Every Supported Database
What we did here for IBM DB2 can be done for any database that ReportBurster supports — SQL Server, Oracle, PostgreSQL, MySQL, MariaDB, SQLite, DuckDB, ClickHouse, and more. The pattern is always the same:
- Start the database (or connect to an existing one)
- Adapt the SQL in the data script to your database's dialect
- Keep the HTML template and component configurations as-is
That's it. The dashboard template, the tabulator config, the chart config, the pivot table config — all of it stays identical across databases. The only moving part is the SQL.
For the full step-by-step walkthrough (creating the report, configuring each tab, understanding every component), head over to the Dashboards tutorial. Everything there applies directly — just swap the SQL dialect for your database.
Cleanup
When you're done experimenting, stop the IBM DB2 Docker container to free up resources.
Ready to Build Your Own?
Whether your data lives in DB2, SQL Server, Oracle, PostgreSQL, or any other supported database — the path to a working BI dashboard is the same. Download ReportBurster and start building.
Like what you see but too busy to set it up yourself? We'll do it for you — just tell us what you need.
From simple setup and configuration walkthroughs, to building custom reports, to deploying fully custom document portals and BI dashboards — we handle it all.
Don't want to deal with infrastructure? We host the whole solution. You'll just log in as admin and enjoy fully automated document workflows.